Introduction
Last month we had the pleasure of being a featured partner of Amazon at Customer Contact Week in Las Vegas. This coincided with the latest major launch from the Amazon Connect team: Cases – See Amazon Connect Cases. This new capability allows agents to track and manage customer issues that require multiple interactions, with integration between Tasks and Cases allowing Amazon Connect to manage the flow of cases through the system. We used our time at CCW to make a start at integrating the Joulica platform with this new capability, beginning with analytics for the following areas:
- Overall case activity, broken down by initiation channel
- Case priority breakdown
- Case categorisation
- Case analytics by customer location
We used the Case event stream - see Case Event Streams, which provides the information we needed to produce the initial set of real time and historical dashboards. The reporting and analytics shown in this article cover real time functionality, but the same metrics are available for weekly and monthly reports and dashboards. We will continue to evolve our integration over the coming months whilst Cases is in preview. Naturally, Case analytics can be combined with the other metrics provided by Joulica to provide unified dashboards across the entire customer service organisation.
Case Activity
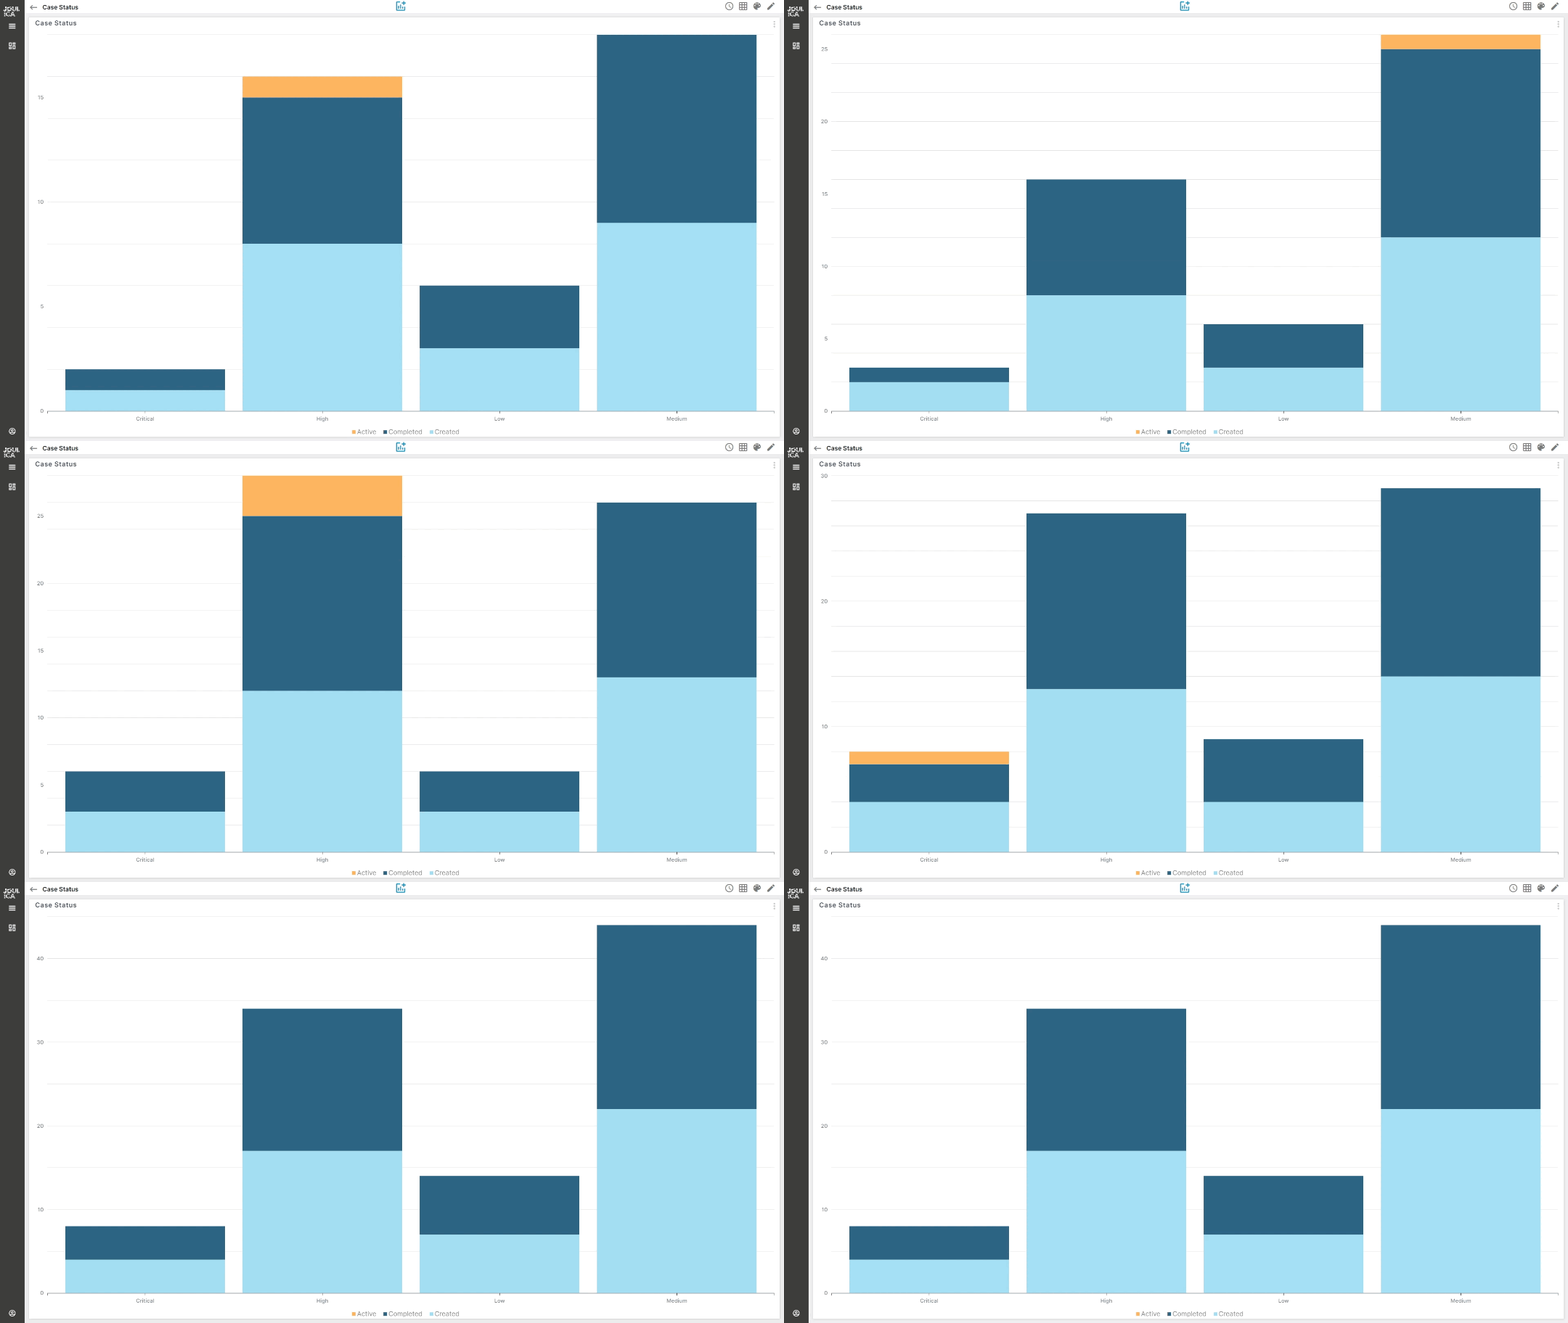
To begin with, the following dashboard shows real-time metrics for created and completed cases, with a breakdown by priority.

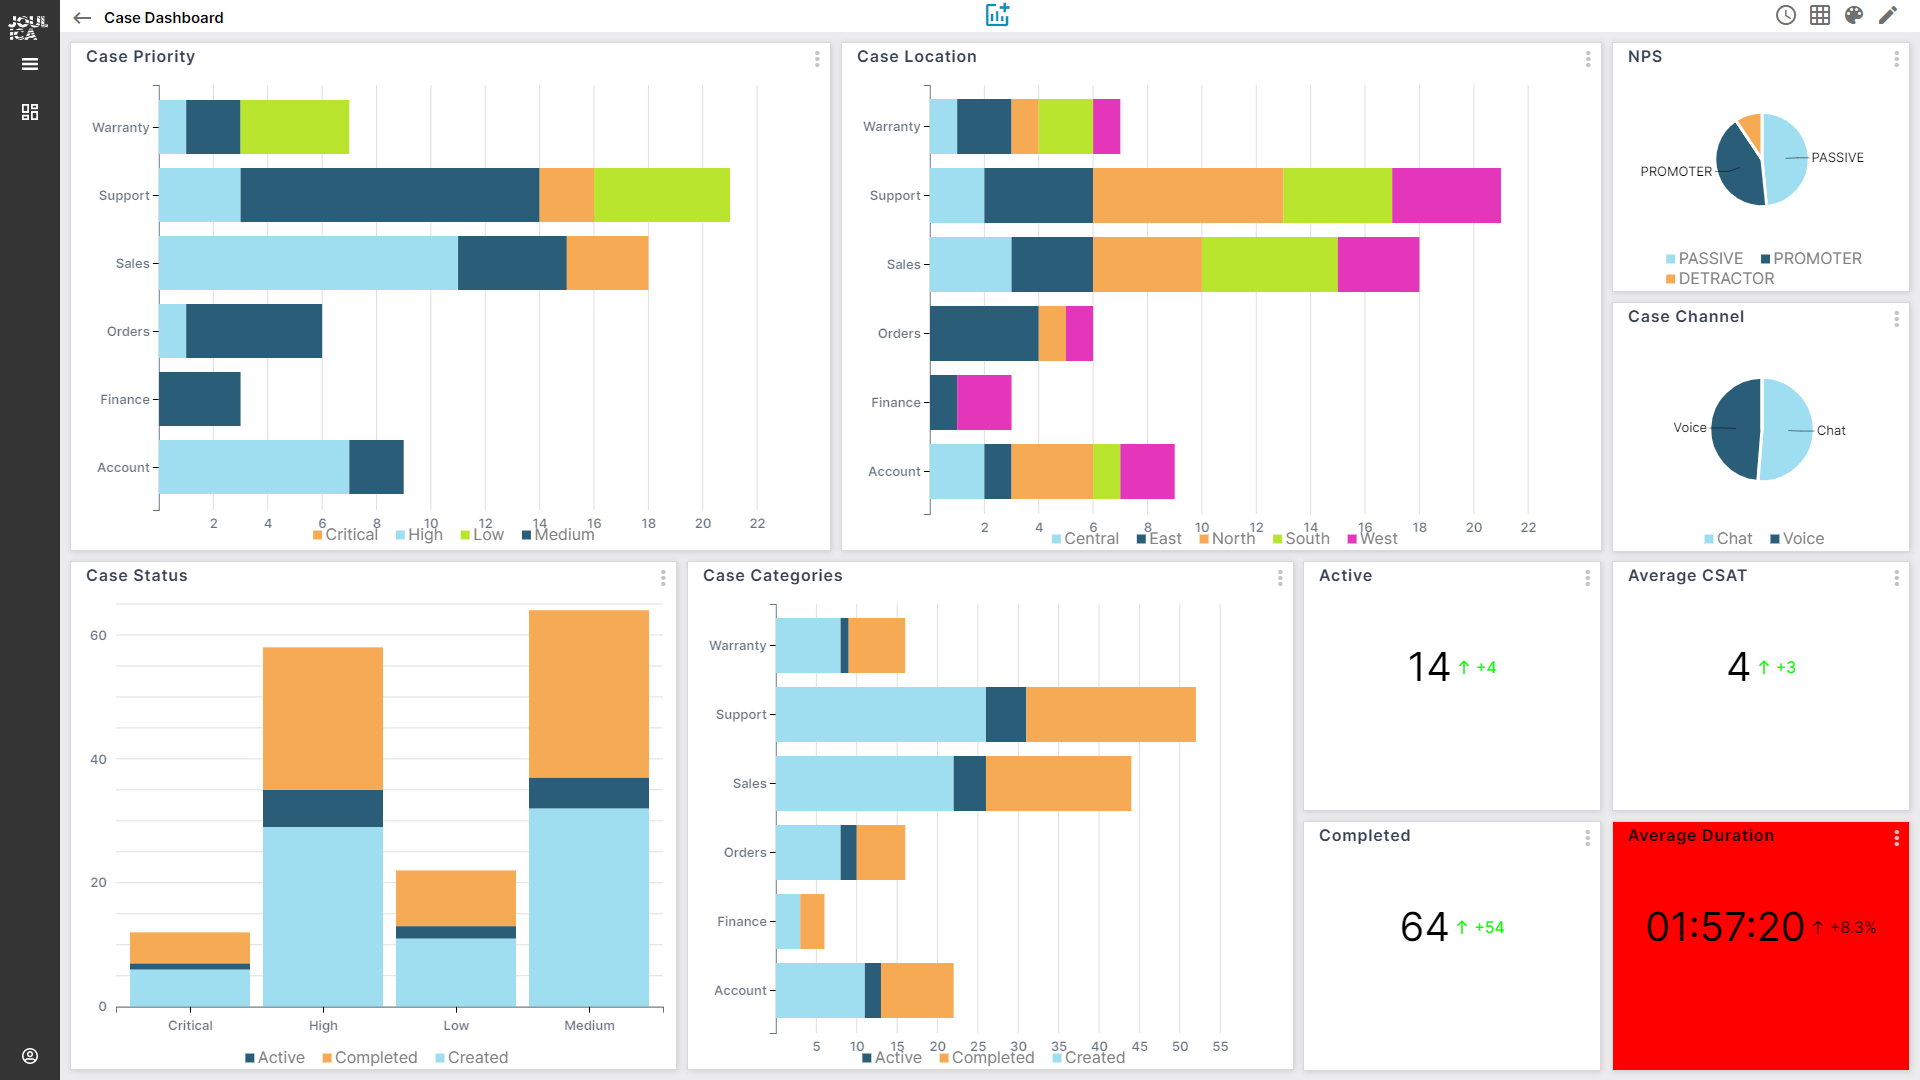
Naturally, as cases are updated during the day, the above dashboard reflects this immediately. Next, some of the base metrics needed to monitor overall Case activity are shown in the dashboard below. This is a real time dashboard showing case categories and status, plus the average length of time that cases were open prior to be being closed. A breakdown by channel and overall customer NPS is also shown that provides Voice of the Customer context. 
Cases can be assigned custom fields and naturally it is important to be able to break the case analytics down by these fields when it is available (Case Templates are supported which allows the key information needed for each case to be specified). Data such as category can be specified in Case Templates, to indicate that the case needs to be handled by the team responsible for a certain area of a product or service. The dashboard above also includes a breakdown by customer location, which could be provided programmatically via the Case API or entered manually by the user.
Bringing It All Together
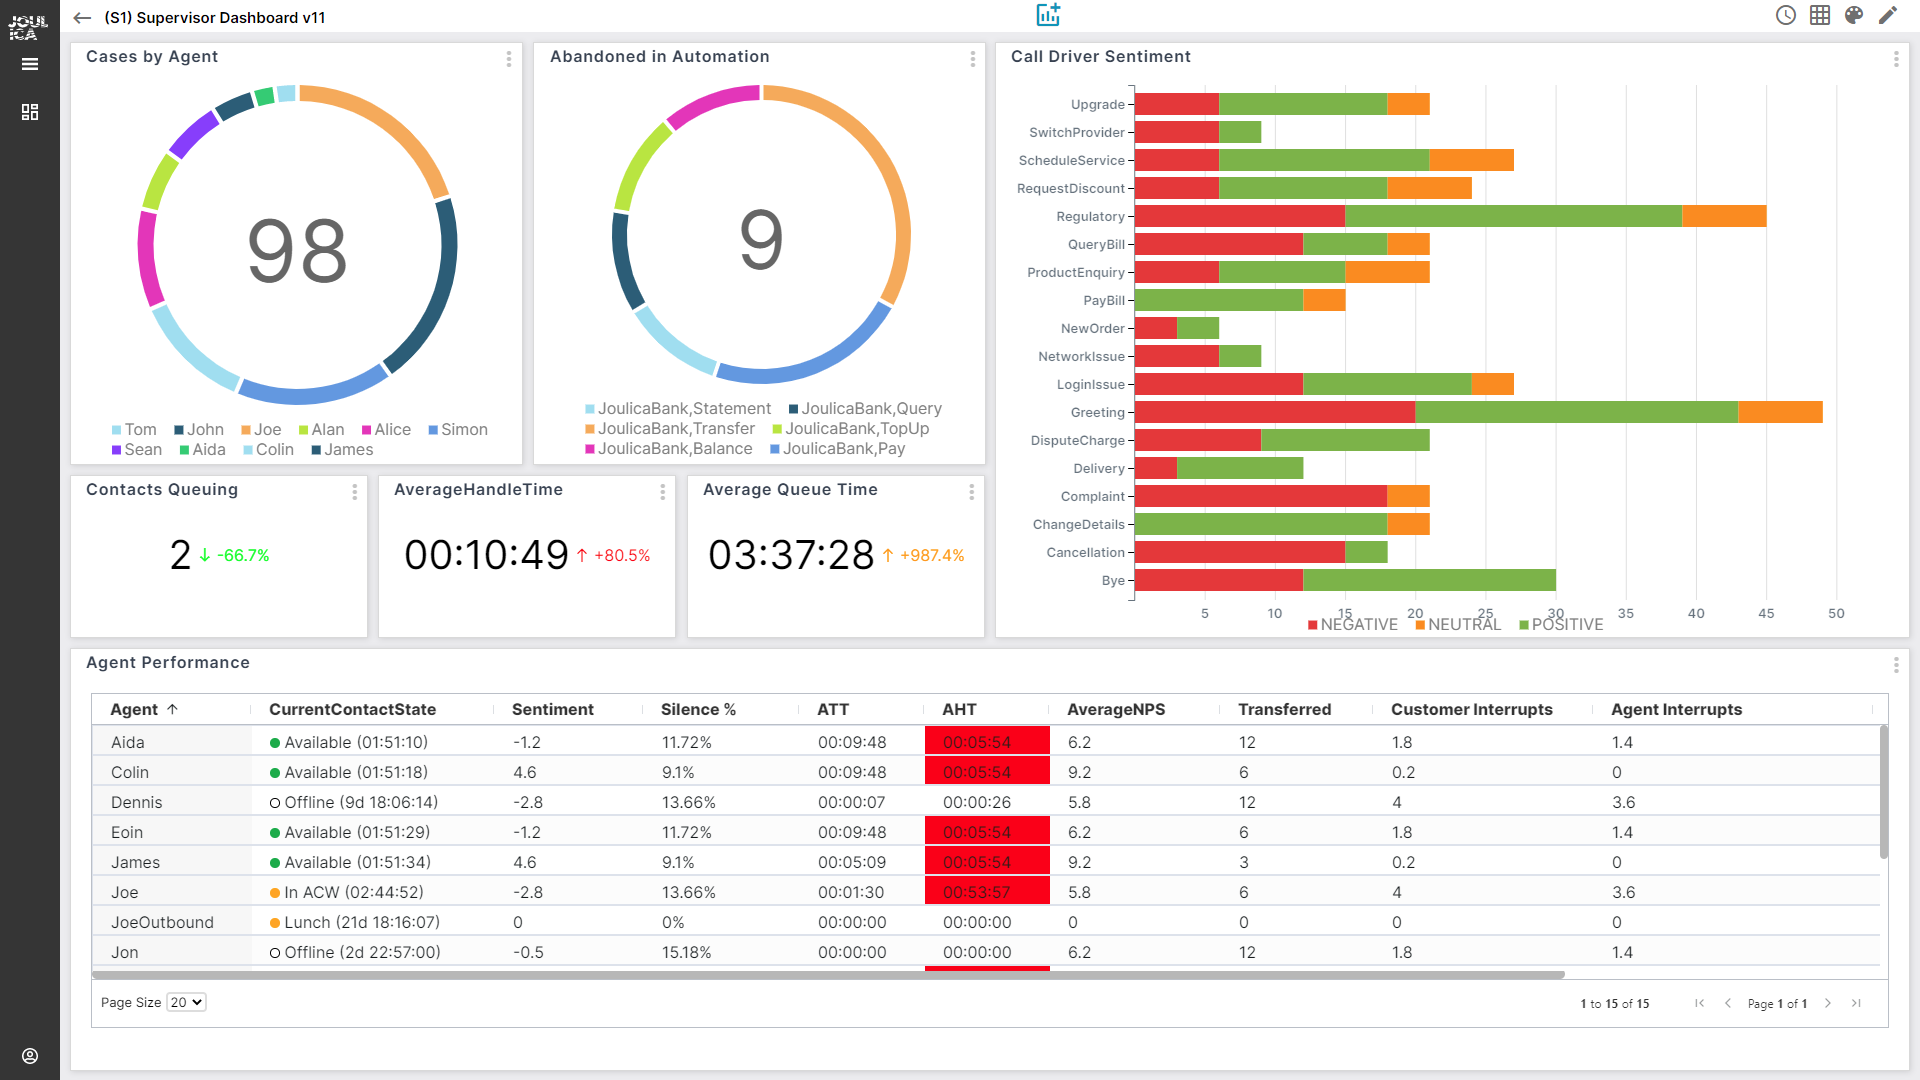
Integrating the above information with other Amazon Connect analytics is straightforward. Within the Joulica application, a new set of dimensions for Cases are available and data visualisations can be added to existing dashboards, or new ones created. The example below shows a combination of metrics for Cases, Agent and Queue activity across Chat and Voice. Customer sentiment for key call drivers is included, which is being taken automatically from Contact Lens. To provide a fully unified view, some critical automation metrics are included, showing where customers are abandoning Lex conversations.

Summary
This article gives just a flavour of the analytics that Joulica can produce for the new Cases feature from Amazon Connect and describes how these new metrics can be added to existing dashboards to provide a fully unified view of customer service operations. To find out more, get in touch by email at info@joulica.io or contact us and we can arrange a demo.

 Amazon Connect Analytics
 Back
Back


