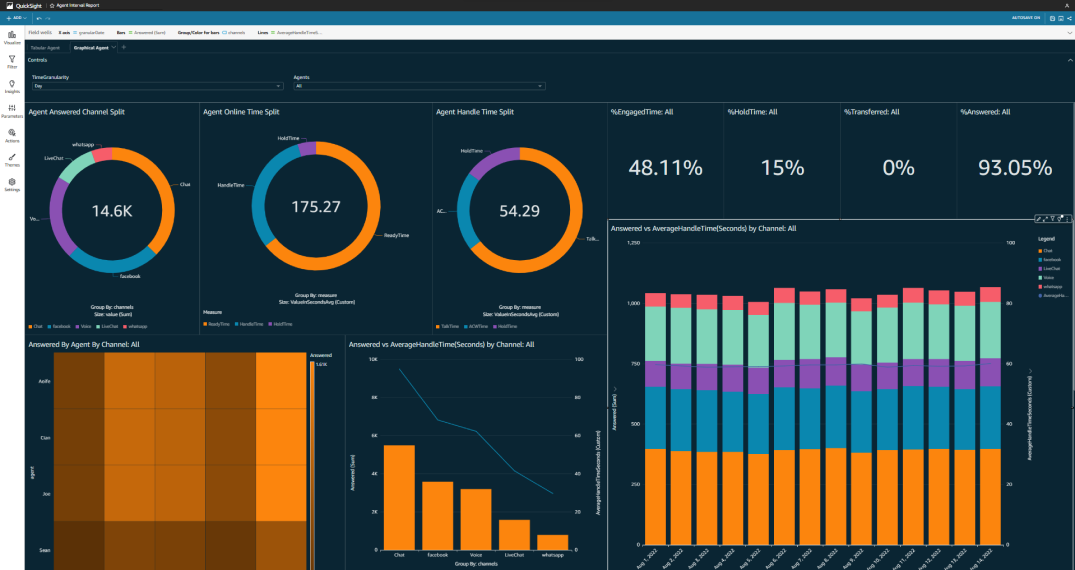
Amazon Quicksight is a cloud-native, serverless, Business Intelligence service from AWS. Its support for a broad range of data sources and innovative AI and ML services (such as anomaly detection, forecasting and natural language question support) make it the perfect choice for Enterprise BI use cases. At Joulica, we utilise Quicksight to provide customers with advanced historical reporting and analytics capabilities. One common request we get relates to allowing users to seamlessly analyse both realtime and historical data, all within a common environment: Quicksight. This post details the recent work we have done to enable this powerful capability – something we are very excited about.
Realtime Analytics
Firstly, we will begin by defining what we mean by realtime analytics. In this context, realtime analytics refers to the continuous analysis of realtime data streams, with the resulting visualisation of the analytics occurring in an event-driven mode (or push-mode). That is, as soon as the analytics update due to new data being available, visualisations automatically update. Using this approach, users always have access to the latest analytics. There are two parts to this problem: 1) the continuous analysis of realtime data streams, and 2) the event-driven visualisation of realtime analytics. The Joulica platform takes care of both of these and integrates with industry-standard event streaming technologies (e.g., those based on Kinesis and Kafka) for access to realtime data.
Example Use Case – Amazon Connect
It’s helpful to give a concrete example of unified realtime and historical analytics, and what better example than using Quicksight to provide a fully integrated environment for real-time and historical Amazon Connect analytics. The figure below shows us adding a realtime widget to Quicksight.
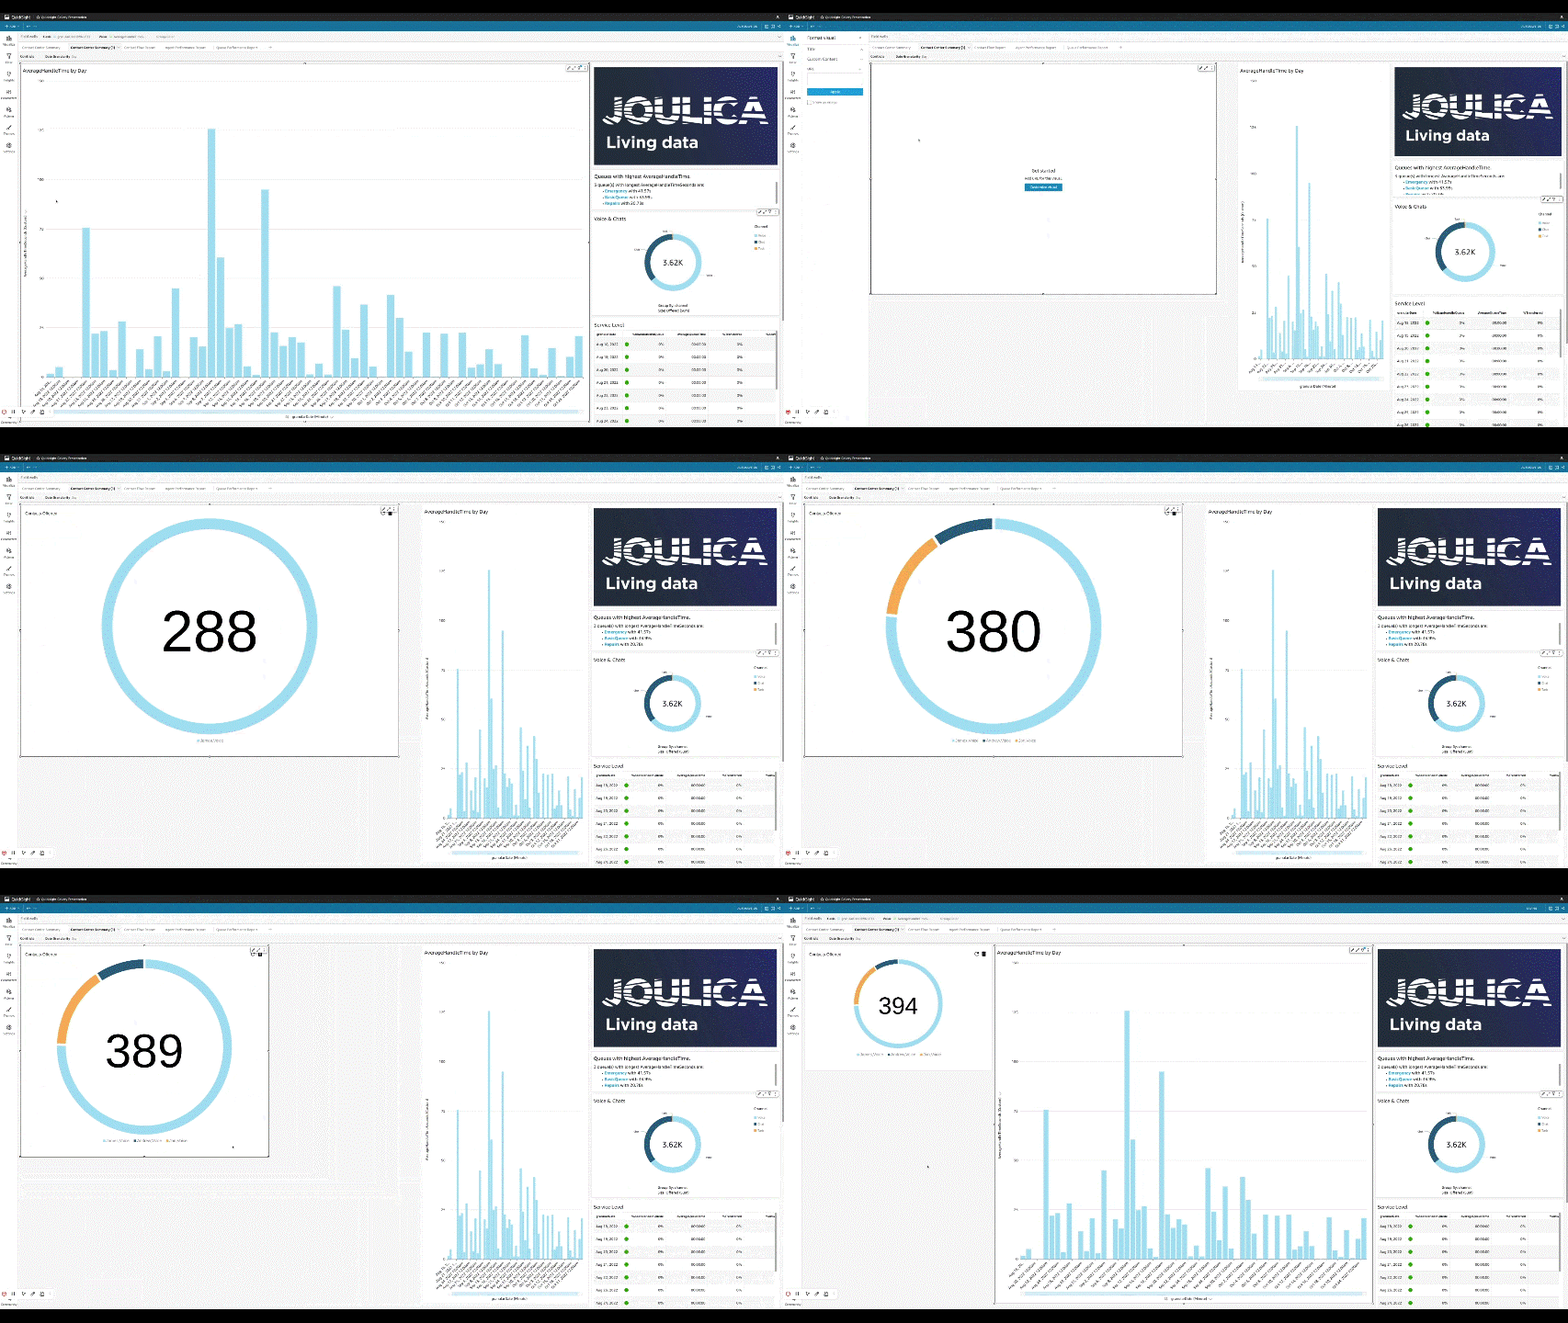
You will see that as soon as the widget is added, the data automatically starts to update. Behind the scenes, Joulica is ingesting Agent Event Streams, Contact Events and a host of realtime data feeds from Amazon Connect, analysing them and pushing a stream of realtime analytics to this widget. We are using the Quicksight ability to include custom visual content (see Using custom visual content in Amazon QuickSight) to achieve this (each Joulica widget has a URI which is all that is needed).
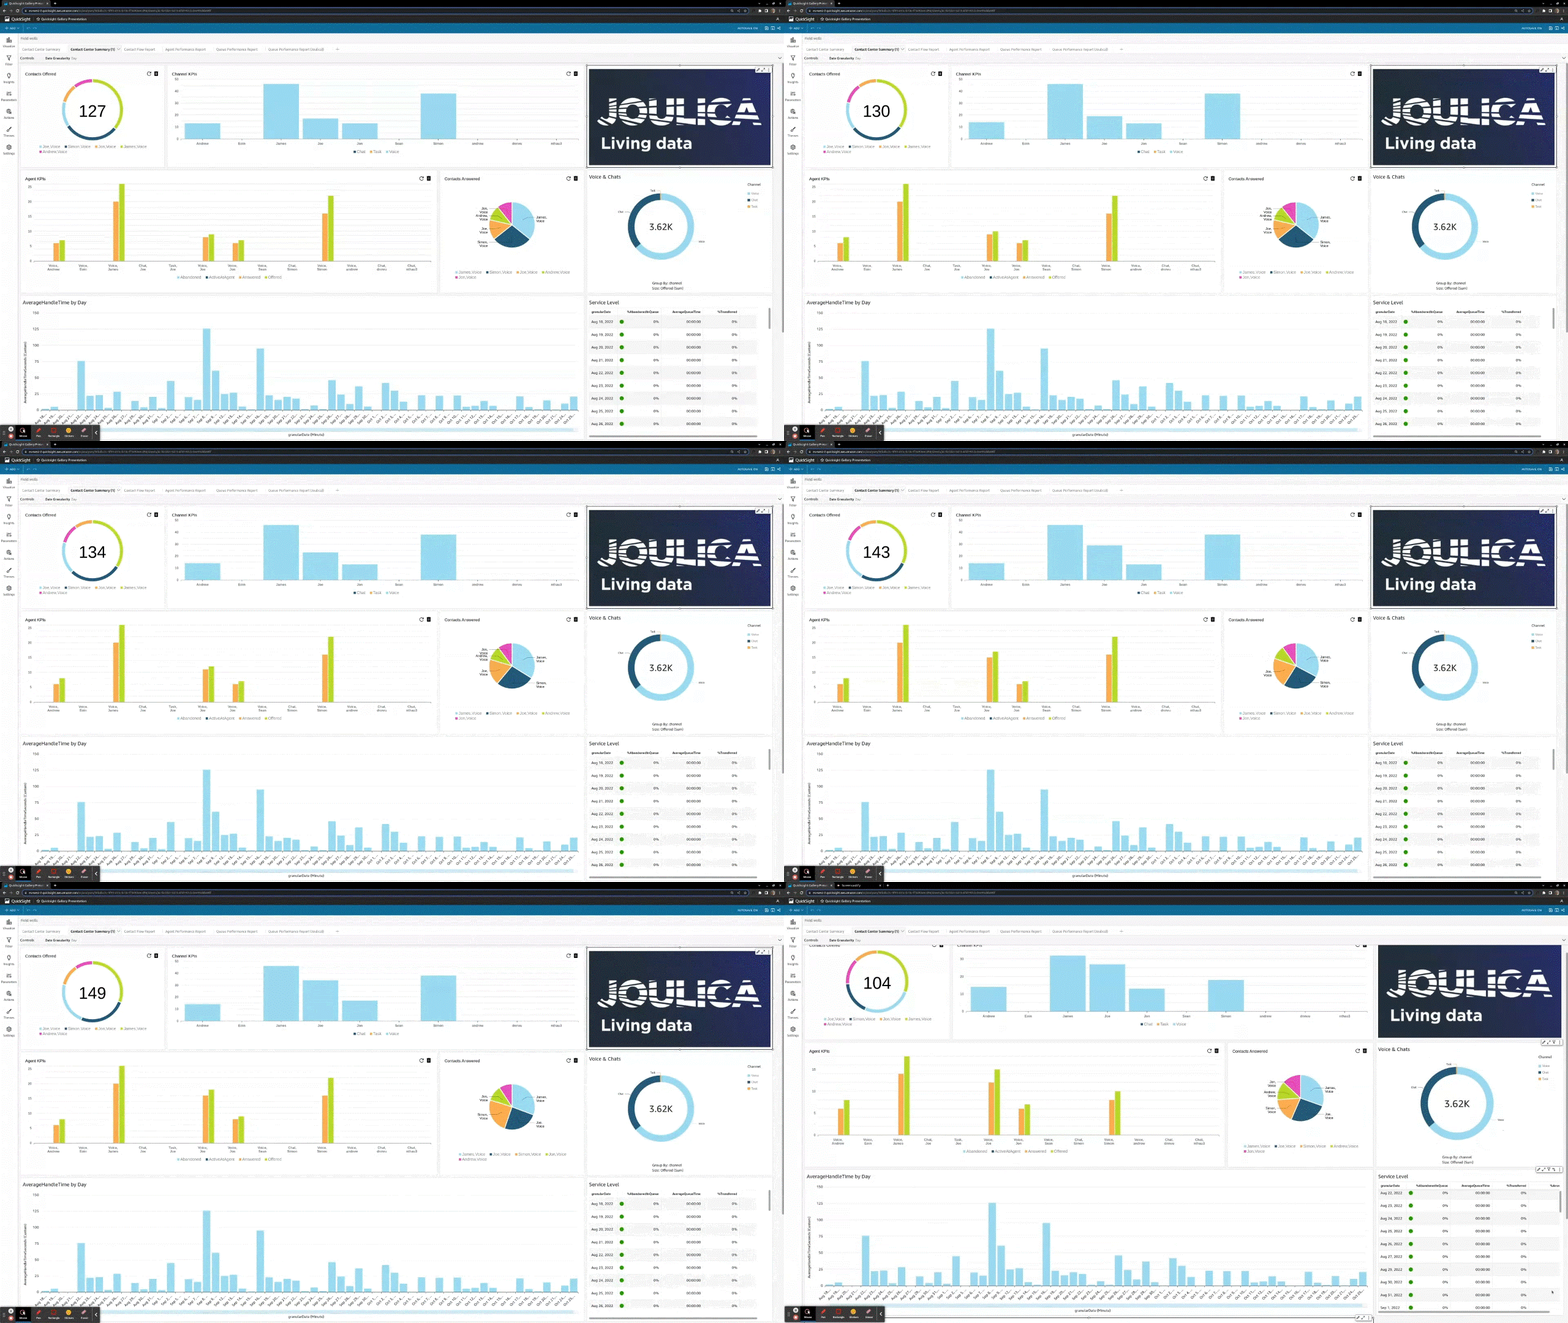
Users are able to mix and match standard Quicksight visualisation content and Joulica widgets, as shown in the example below.
If a user wants to include more classical realtime content, such as a simple realtime Agent performance table, then this is also possible, as shown in the following example.
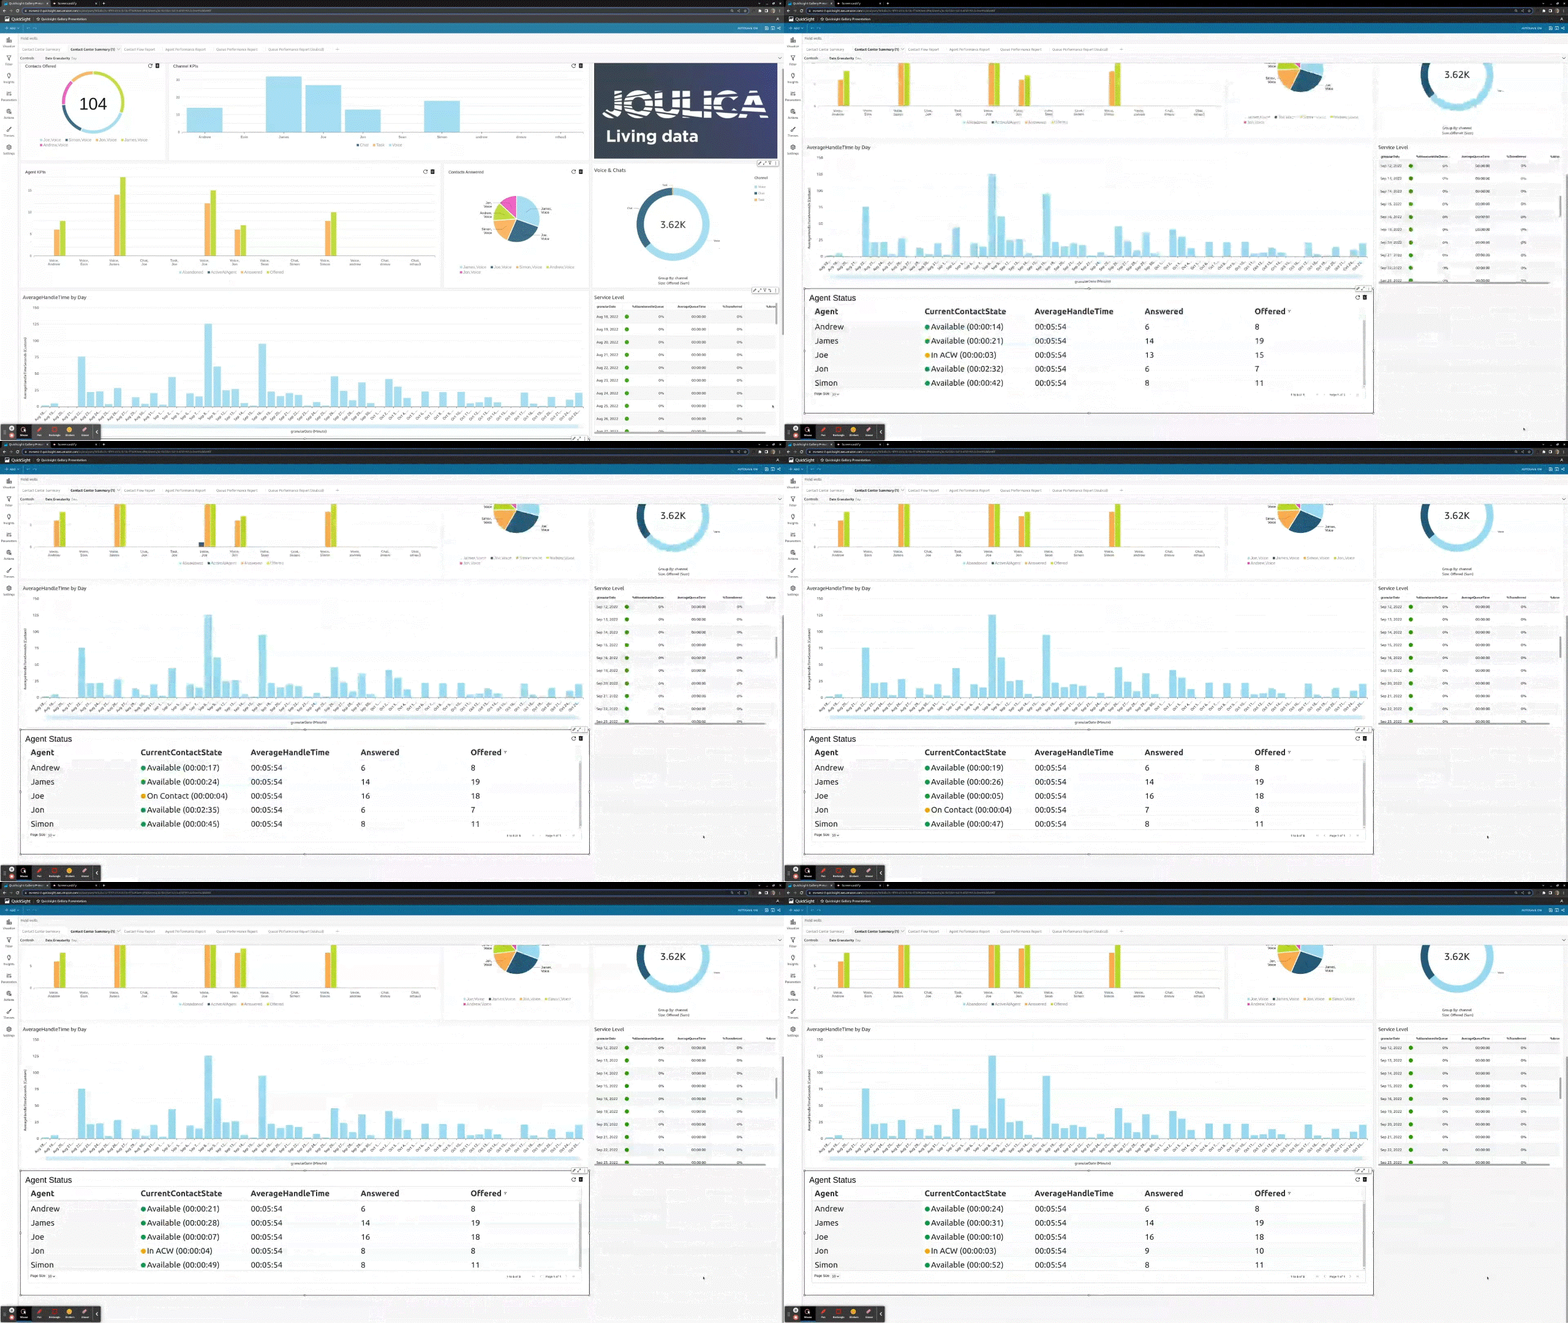
As can be seen, Agent state changes, time in state and other metrics all update in realtime.
The end result is that Quicksight can now be used to analyse realtime, historical and predictive analytics for Amazon Connect, all within a single unified Quicksight environment – pretty neat.
Summary
The Contact Center is a domain where realtime and historical analytics play a critical role. With customer servicing strategies becoming more sophisticated, and utilizing an ever-increasing number of channels, the role of analytics is playing an even more important role. Here we have shown that it is possible to bridge the gap between realtime streaming analytics and mainstream business intelligence and provide users with a single unified analytics environment: Quicksight. As always, to find out more, get in touch by email at info@joulica.io or contact us to arrange a demo and free trial.
PS – Naturally there are lots of interesting use cases outside of the contact center domain for unifying realtime and historical analytics within Quicksight – watch this space!

 Amazon Connect Analytics
 Back
Back