AWS is unique in the Contact Center market with the depth of its Amazon Connect capabilities and the AI services from the wider AWS ecosystem. Using these AWS services, organisations can deliver rich automated experiences that utilise the same underlying technology as Alexa, as well as implement Intelligent routing and AI-powered agent experiences. Companies can even use Amazon Connect Cases to track, collaborate, and resolve customer cases. These capabilities generate lots of data that can be analysed to generate actionable insights, which in turn can be used to foster continuous innovation. As a result, customer experiences can be constantly improved, and processes can be made more efficient. This is particularly the case when analytics are available in real time. And as you know by now, Joulica loves real-time analytics!
This article explores typical use cases where the Joulica platform can harness the rich data sets available from Amazon Connect and AWS, broken down into the following broad categories.
- Natural language, automated services powered by Lex
- Intelligent Routing and Queueing
- Agent Experience and Performance Management
- Case Management
To begin with, we describe some use cases that span the full solution, showing some unified analysis across the full set of services.
Solution Level Analytics for Amazon Connect
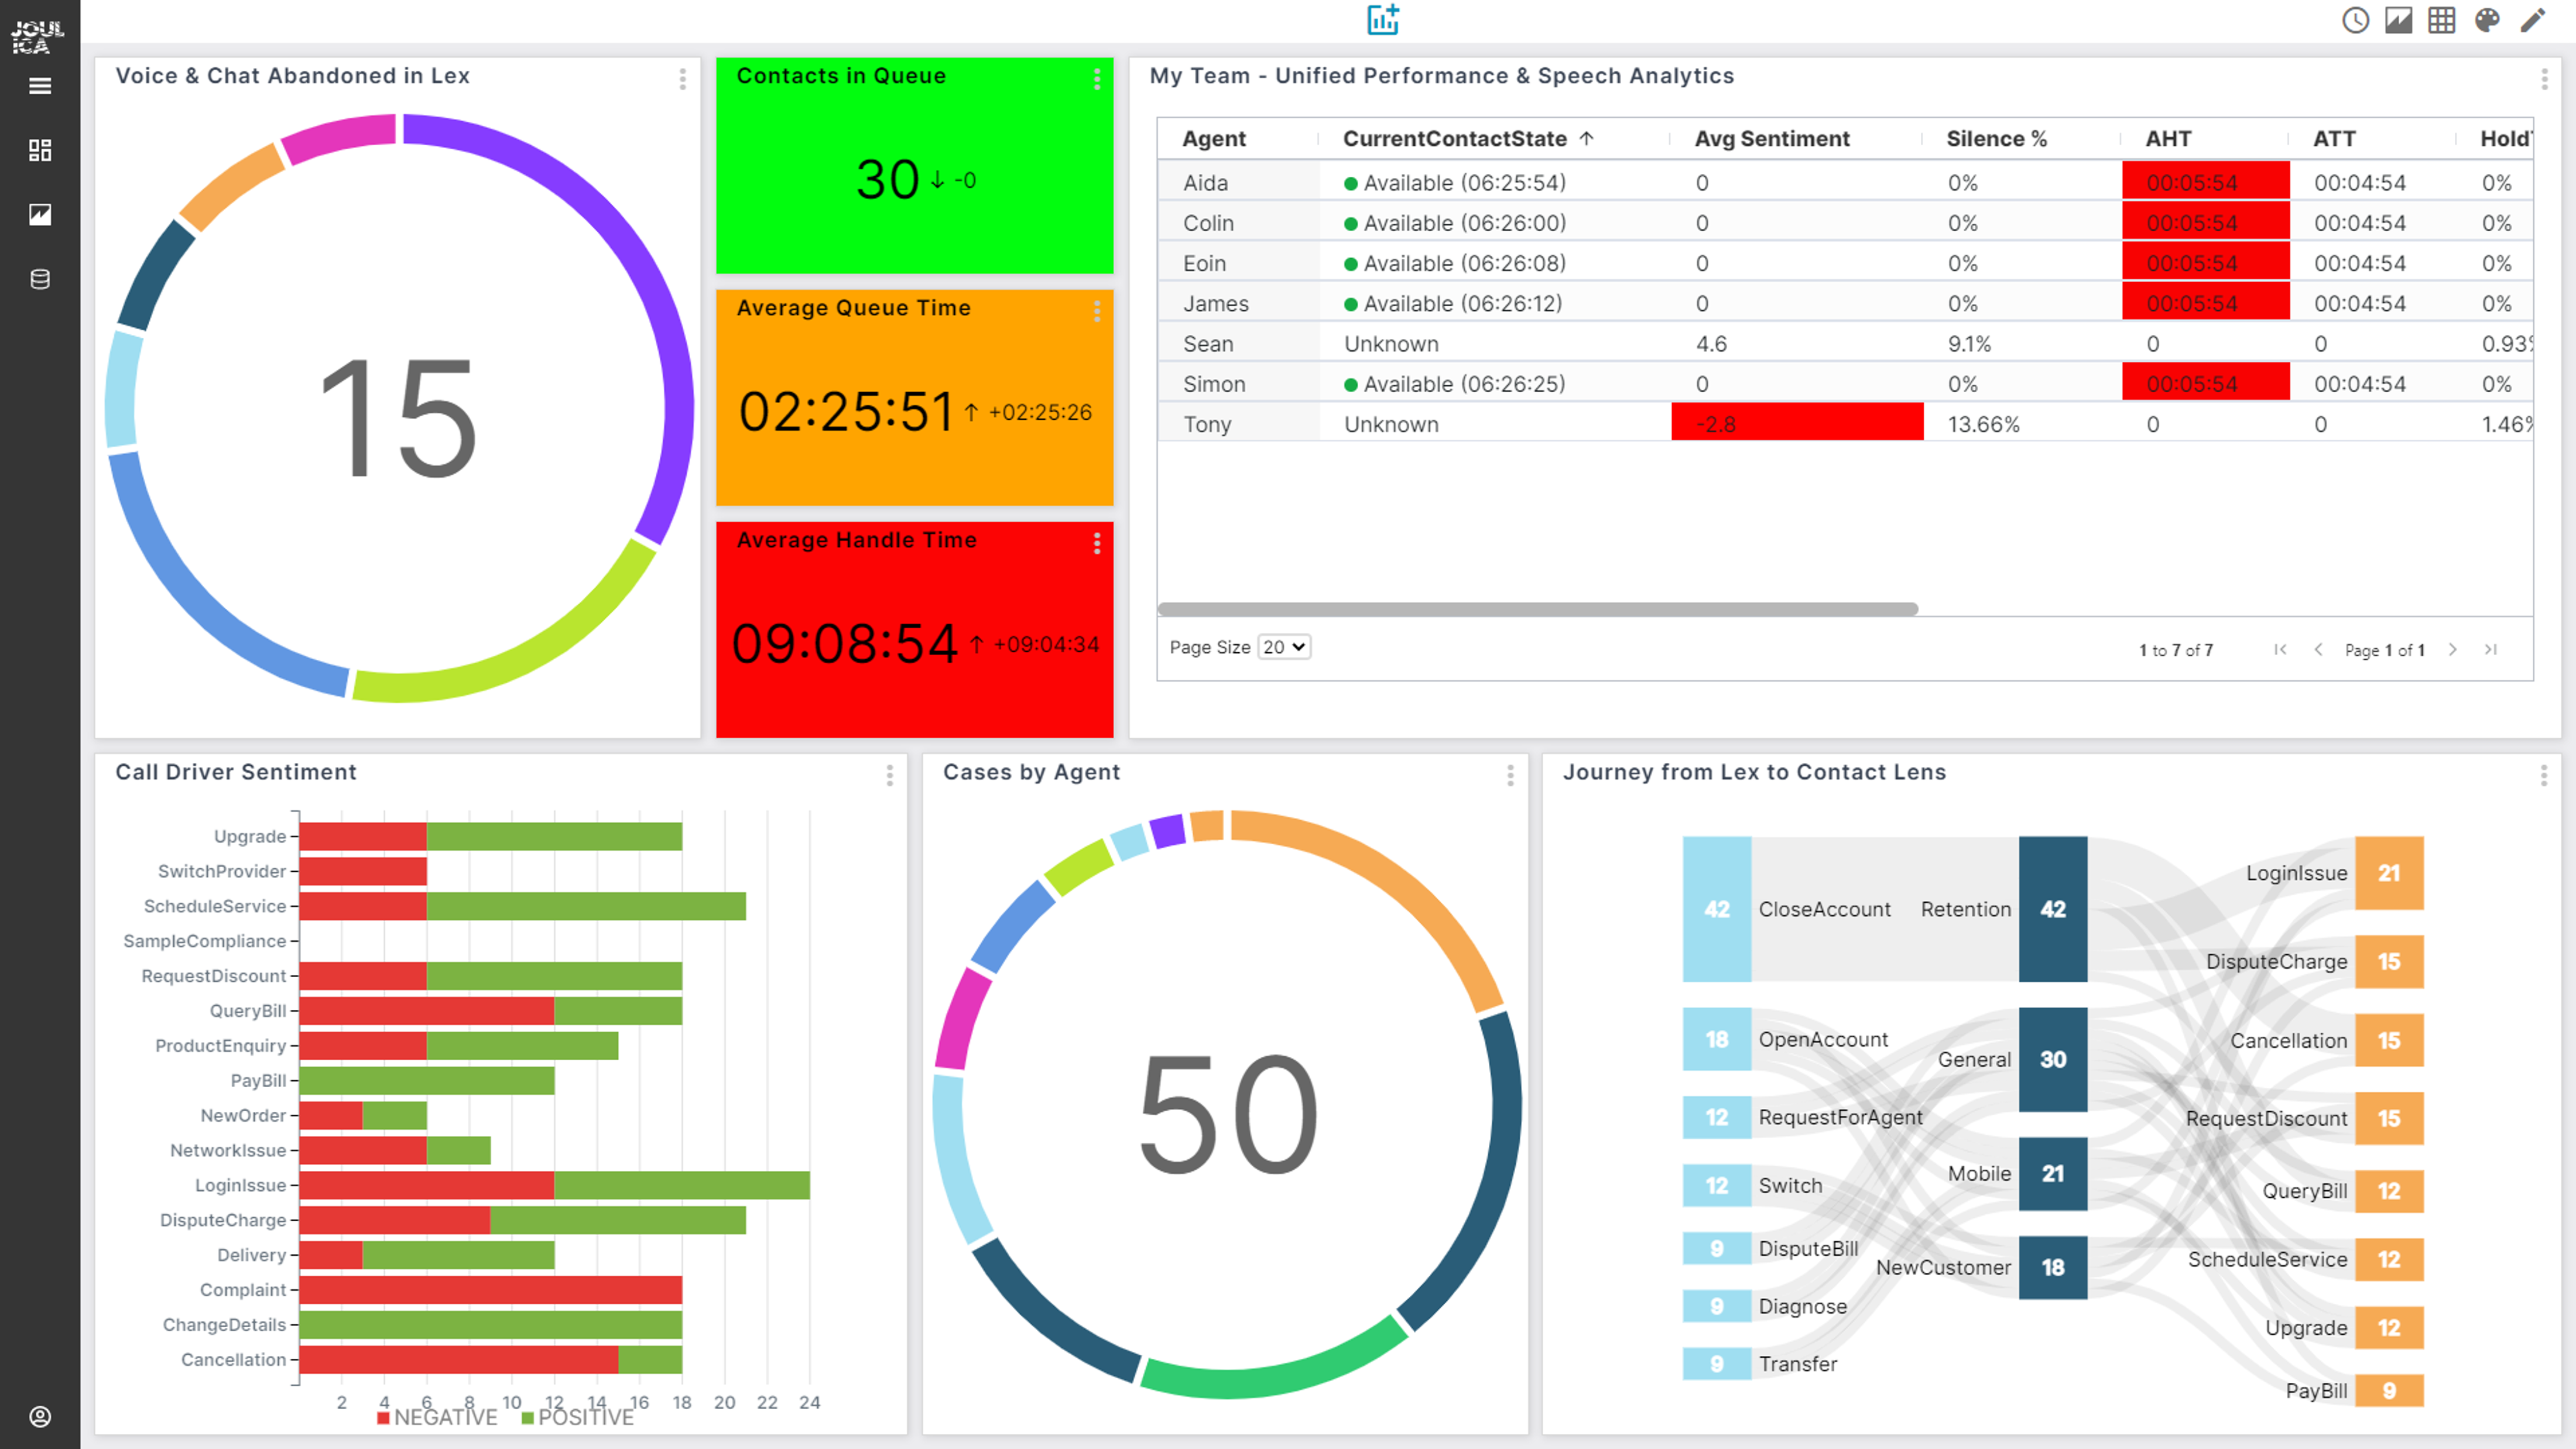
Customer service leaders manage customer interactions that are increasingly automated, they must deliver on service levels, manage agent performance as well react to anomalies such as spikes in poor customer sentiment. The analytical dashboard shown below is an example of unifying key KPIs across all these areas. The agent performance metrics include sentiment and silence analysis alongside the standard performance KPIs you would expect. At the bottom center, we show Case metrics for back-office activities. To its right, some KPIs are shown for Queue transfers from Amazon Lex and the subsequent call drivers identified by Contact Lens. For each call driver detected by Contact Lens, we show the aggregate customer sentiment.
Another example of where analytics provide value at a solution level is analysing the behaviour of repeat customers. Questions such as: Which customer intents drive repeated customer interactions? What is the result of revenue and customer feedback, and how does this vary across channels? The example below shows how Amazon Quicksight can be used to explore Joulica customer journey analytics that answers these questions over a period of several months.
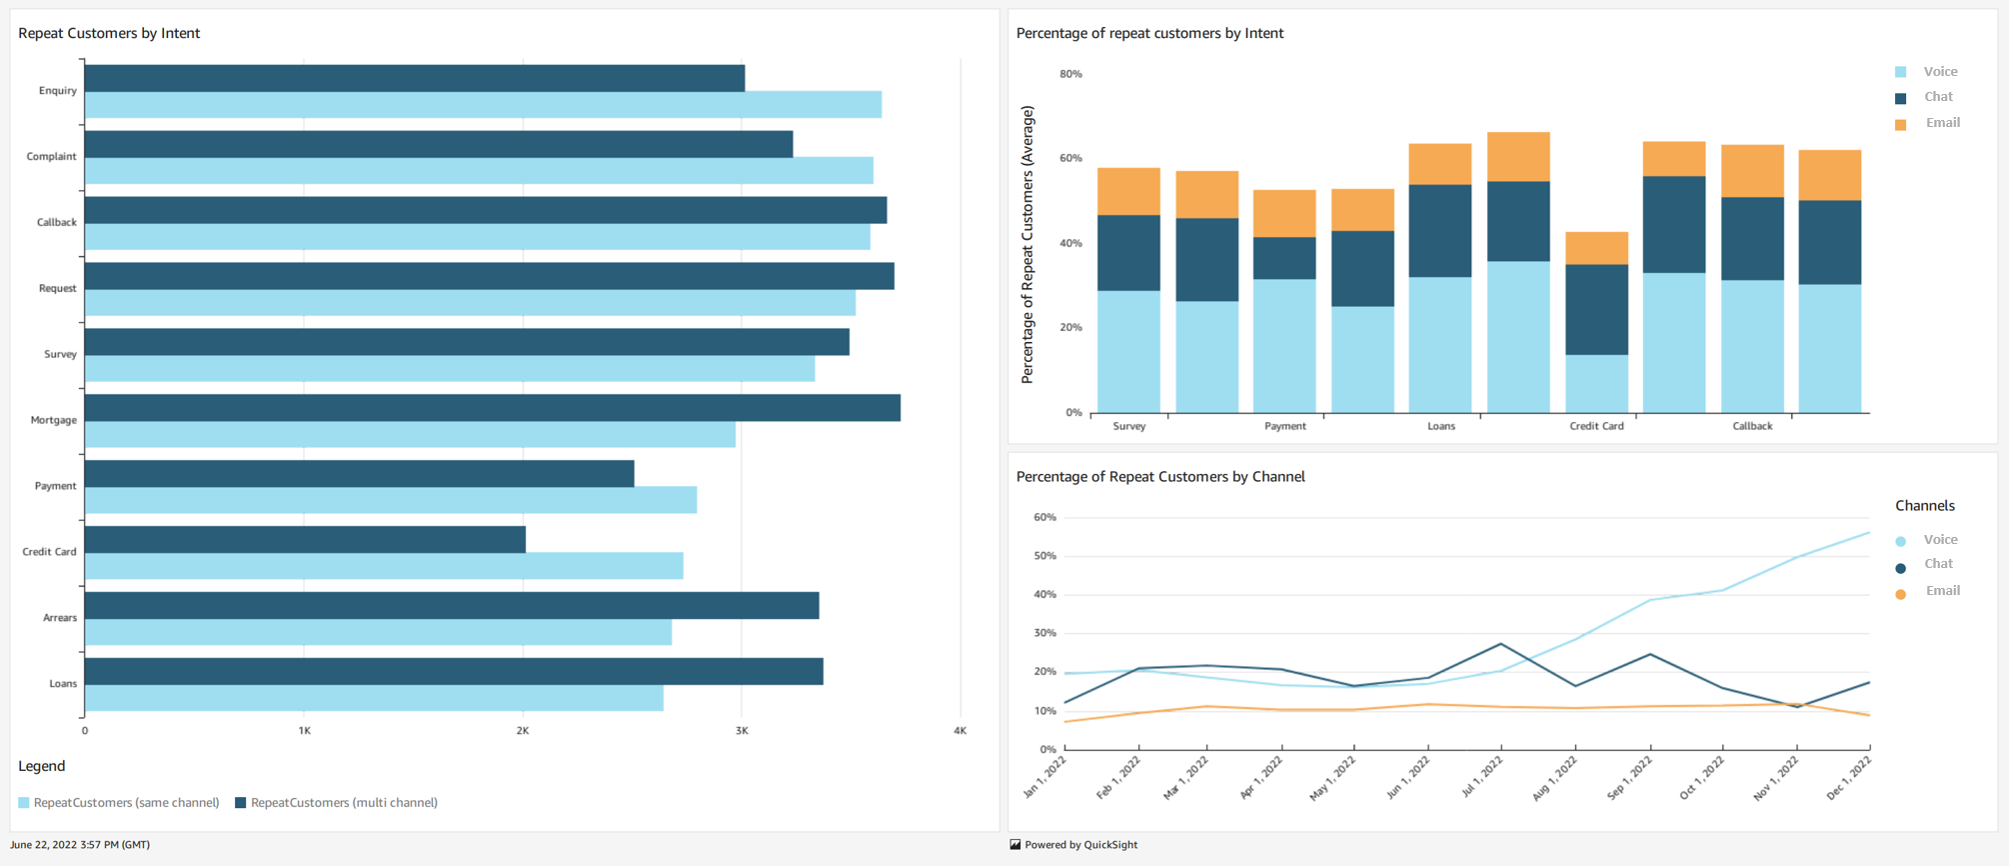
Using both Joulica’s analytics platform and Quicksight for historical data analysis, users can develop these types of dashboards with ease. We are now going to dive deeper into key areas of the CC solution, beginning with Amazon Lex.
Amazon Lex Insights
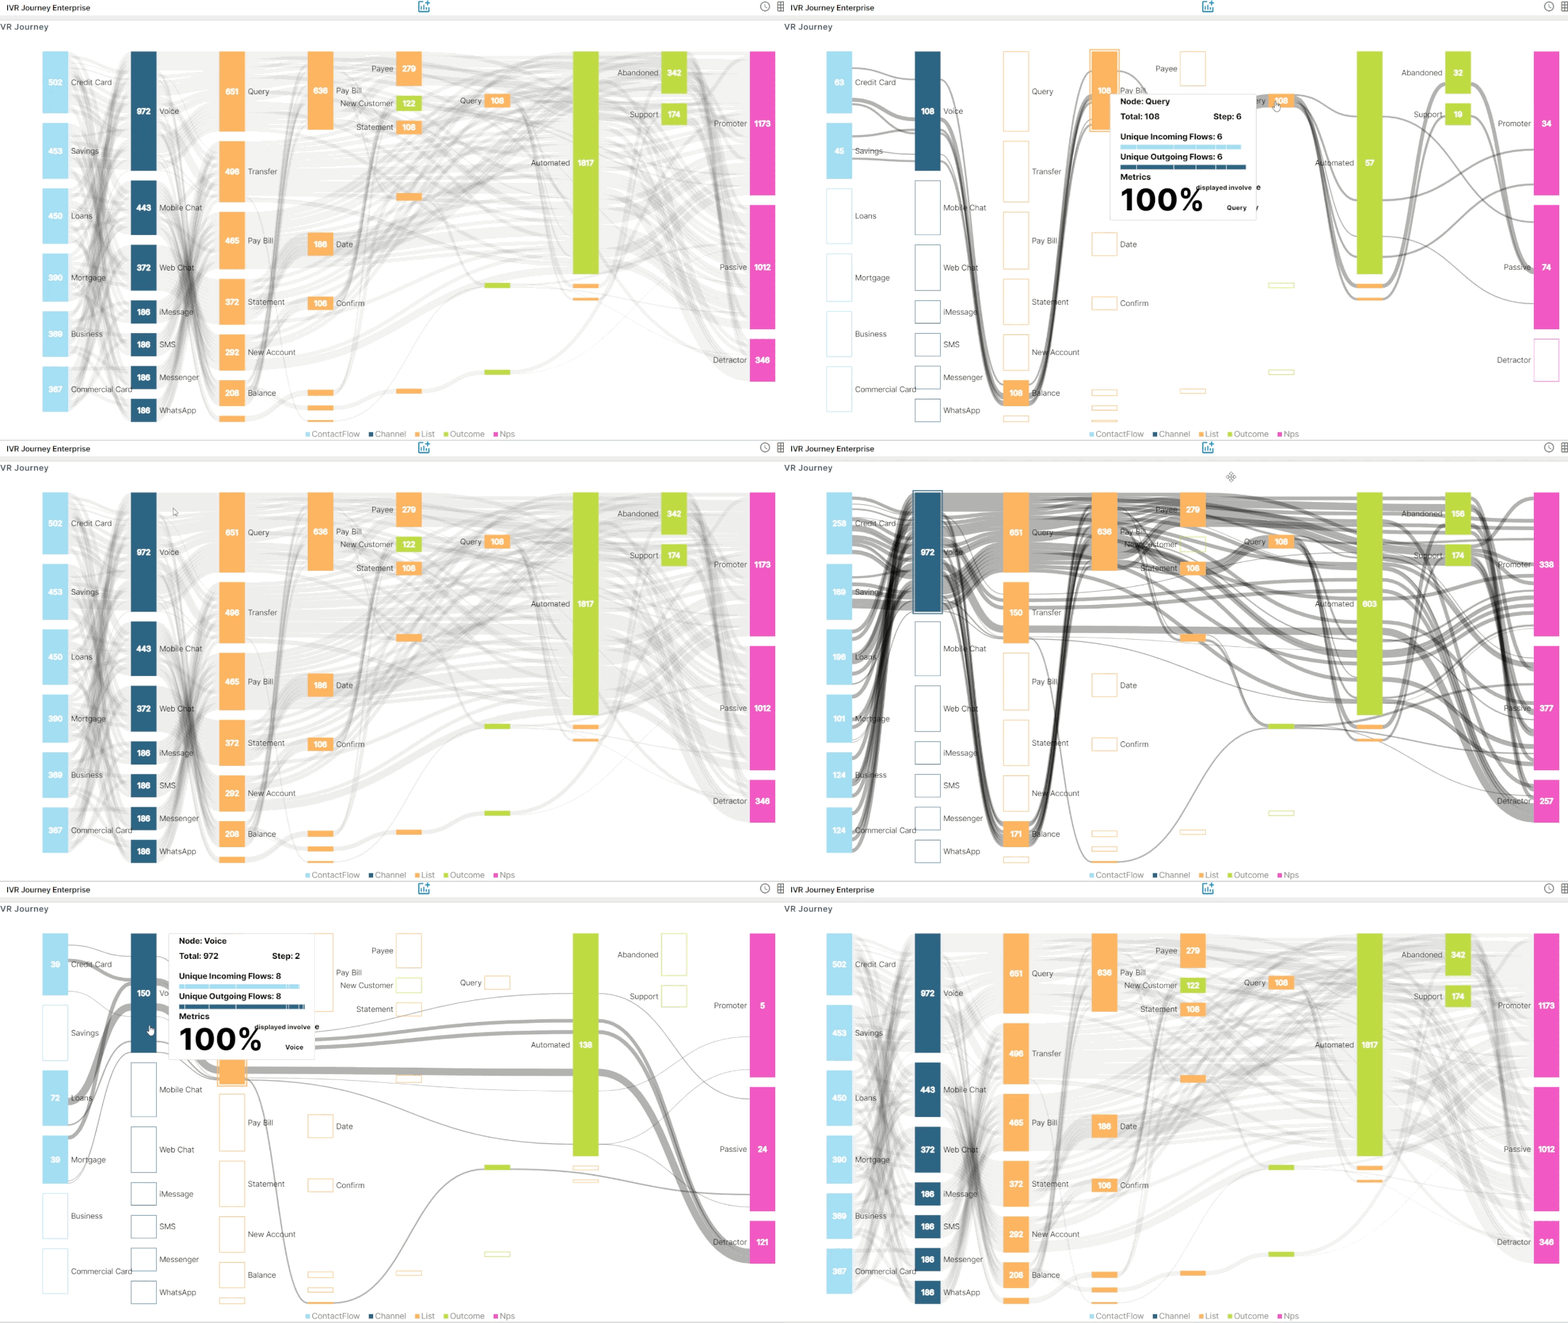
Contact Flows can be used to build dynamic data-driven services that utilise Lex for automating natural language customer conversations. Applications can be developed once and offered over multiple channels, with the Contact Flow graphical user interface allowing iterative changes to be rolled into production in an agile manner. To continuously optimise these services, organisations need to understand the questions customers are asking on each channel, whether customers are having their questions answered, in addition to the specific areas of the Lex application that are leading to an agent being required. You can then move onto understanding more complex interactions such as multi-intent conversations, plus measuring customer sentiment and satisfaction. The figure below provides an example of how analytics derived from multiple data sets can be explored to gain these types of insights. Users can drill down to individual interactions when needed.
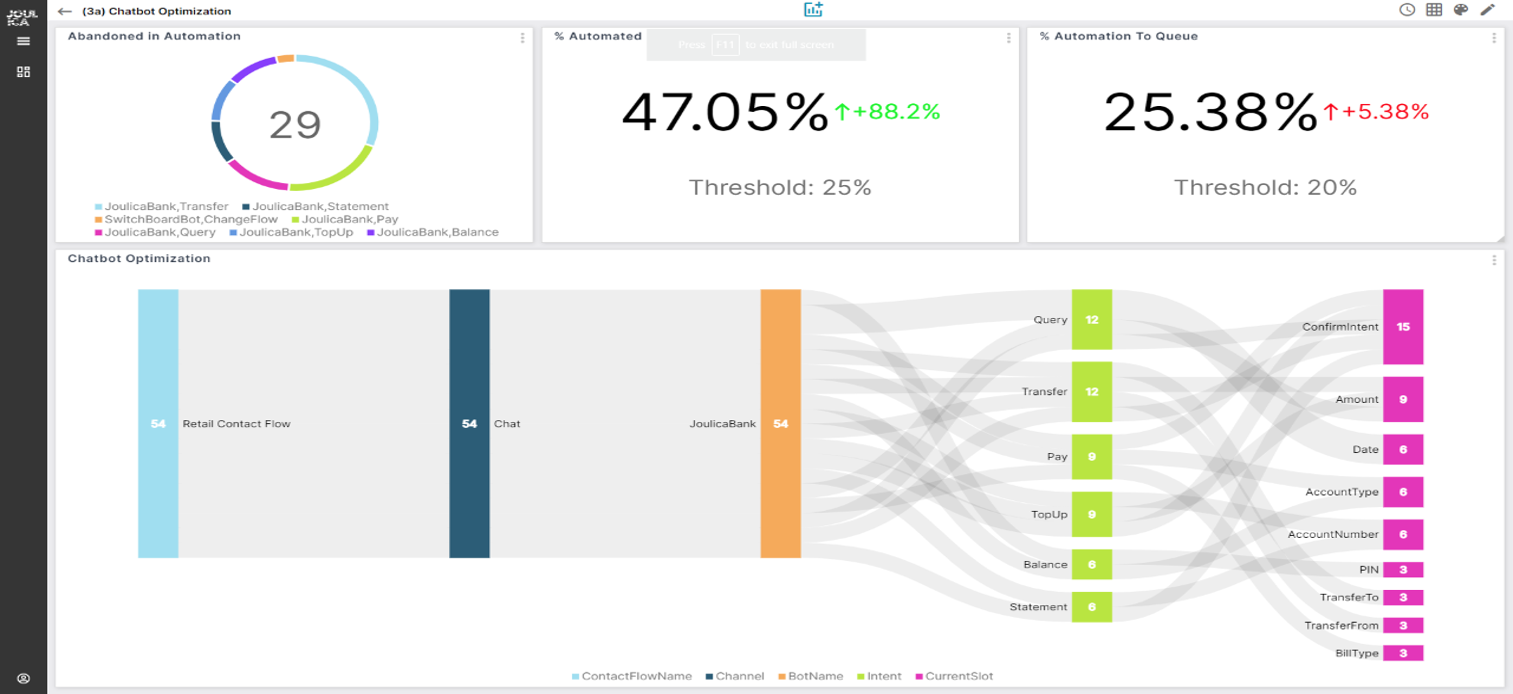
If users are interested in summary analytics such as containment rates, or analytics for specific contact flows, channels, or bots, this is straightforward as shown below.
Intelligent Routing and Queueing
The co-location of automated services business logic and routing/queuing business logic is a big benefit of using the Amazon Connect Contact Flow designer. Queue metrics are among the most standardised metrics in the CC industry, with supervisor dashboards, wallboards and agent desktops commonly used to visualise the data. With Amazon Connect, Agent Event Streams and Contact Events provide live event feeds that allow Joulica to offer these standardised metrics in realtime. Our consumption of these raw events also gives us the ability to customise how metrics behave, such as service level definitions, how short calls are handled, interval durations, and even how event attribution is handled. Of course, we also integrate with the GetCurrentMetricData API. Some example Queue metrics are shown below (the second example being more suited to a wallboard).
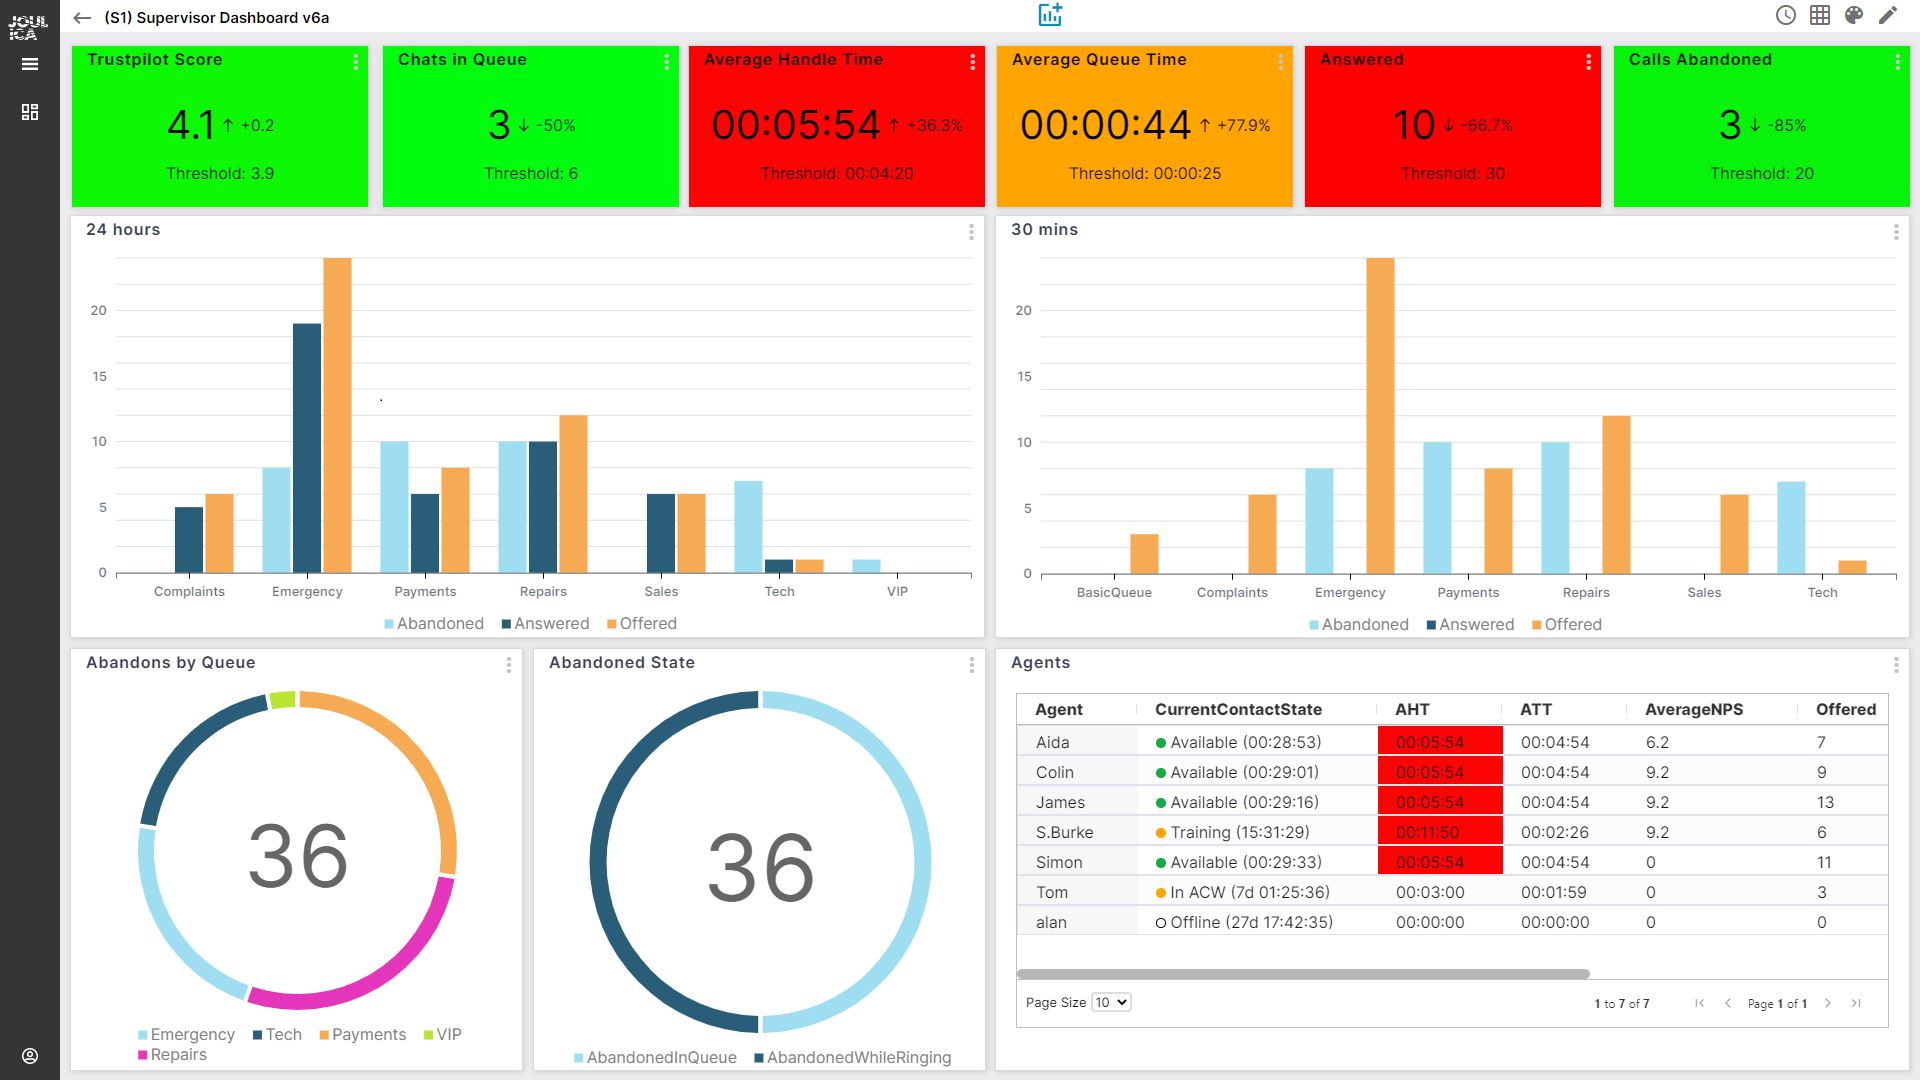
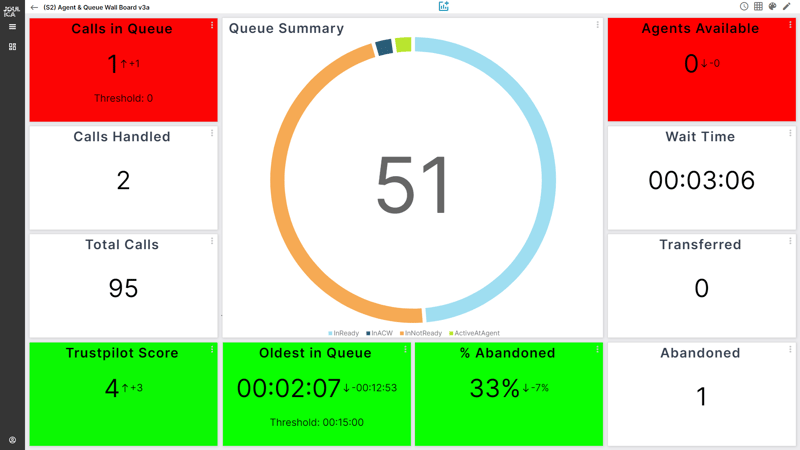
Because of the real time nature of the Amazon Connect event feeds, and the Joulica streaming analytics engine, the dashboards are highly responsive and always provide low latency real time updates. Integration of external data sources is included in these examples (the example above shows Trustpilot scores).
Agent Performance Analytics
Amazon Connect offers several data sources that allow analytics to be computed that go beyond the standard agent performance metrics that are mainstream in the CC industry, some of which are shown in the above examples (such as an average handle or talk time). The example below shows how speech analytics data from Contact Lens can be integrated with agent and contact event feeds to compute agent analytics broken down by the driver of the customer call. Using this, supervisors and managers can target training and coaching with individual agents who need help with certain types of calls (e.g., long handling time for certain call drivers and/or poor customer sentiment). Sentiment, Silence-time and Interrupt analytics also provide valuable insights that allow agent performance to be optimized.
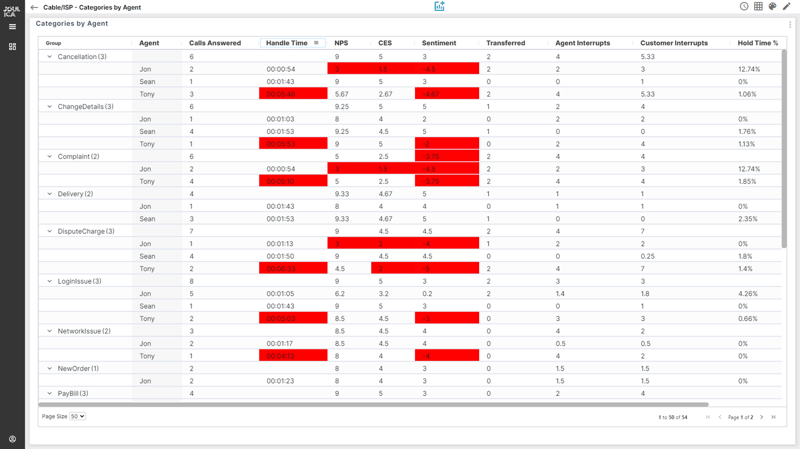
When Contact Lens is used to monitor agent compliance with corporate standards, Joulica can transform Contact Lens data feeds into Agent-level adherence reports, as shown below.
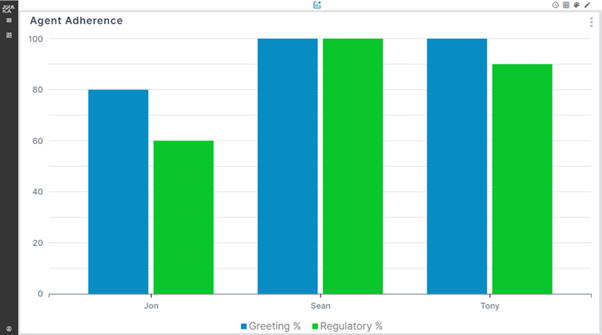
Of course, users can create their own analyses which merge data across multiple areas, such as the one below and share them with their colleagues.
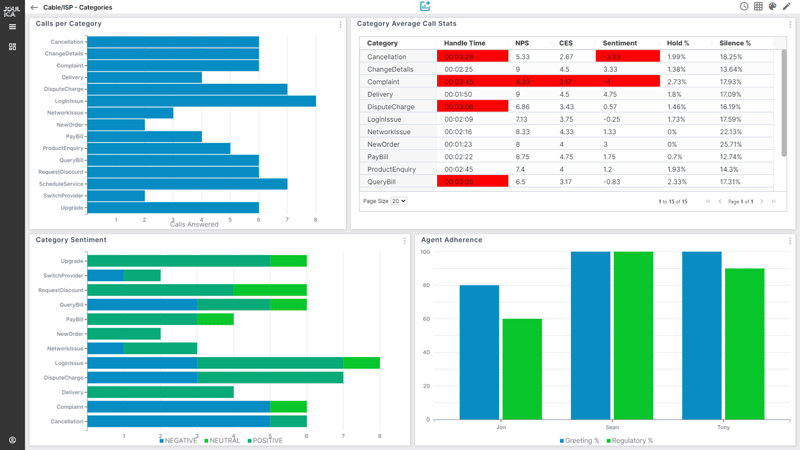
In many cases, the customer care team is required to carry out follow-up tasks and to work on these outside of the customer interaction – which is where Amazon Connect Cases comes in.
Amazon Connect Cases
Amazon Connect Cases allows organisations to track, collaborate, and resolve customer cases, and so from an analytics perspective, some of the key KPIs center around case creation, resolution rates without customer follow-ups, and case status. Amazon Connect supports a lot of functionality around Case templates with support for custom fields, allowing entities such as customer location to be tracked. The example below shows a real-time dashboard allowing case KPIs to be analysed. In all examples, the Case analytics are derived from the event feed provided by Amazon Connect.
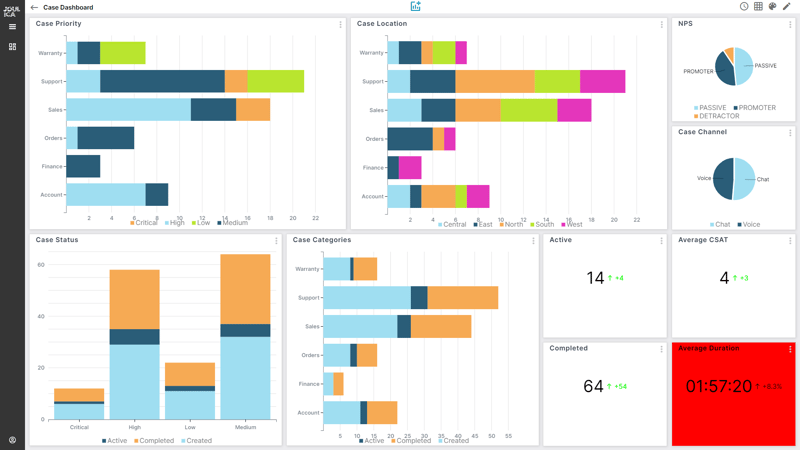
Similar to previous examples, all of this data is persisted in Amazon RDS with Quicksight reports easy to produce, e.g., to analyse weekly or monthly trends and correlate with business metrics such as revenue or customer retention.
Summary
This article took a tour through the rich set of analytics that we derive from the data sources provided by Amazon Connect and other AWS services. It can be seen that there is a treasure trove of data to be mined, allowing both real-time and historical insights to be derived. We hope you found it interesting - to find out more, get in touch by email at info@joulica.io or contact us to arrange a demo and free trial.

 Amazon Connect Analytics
 Back
Back